
Page 183 [183]
{ "65346. antonine lady.ws (F:\Technical Imaging\WP10.3b_c meeting\Materials\Test Images) - vilstray - nil
Elle Edit View Toolkits Help
input | linear | markup | viscalb / uvicalib align specden falsecolour _uvistray | anki visvay] vikm / results
MAC > getspedtralon from U-I /-induced visible lum
A
2 label = isible-induced IR luminescence
a visible-induced IR luminescence
Aa
= =
>| ¢33 |_| straighten_prompt | Position line along edge of reflectance standard in visible-induced IR lumin... I Taj eflectance
input.Pair_new align.B1.label align.B2 align.B3
A
v
straighten_image
A
ws line Arrow on C33.straighten_image at (2040, 2416), offset (8-962),
enclose_prompt | Enclose the reflectance standard with box
A
KS box_image
S| 930 | viscalib.c35.matrix
Alon)
S| 981 | c33.matrix
a |
S/ ase |99.8396 [95.5074 | 105.833
Aa
v
A
v
rotate_prompt | Rotate the reflectance standard to get white at the bottom-left
first | Extract from row: o
(number | Extract ct this many rows: 1
a jy AS Q39 7.9387 18.35239 | 9.09431
A
angle |Rotate by: | 90 degrees clockwise
first ma Extract from row: o
rotate_widget 0 box, NULL == default | ES
D
(O)inb... | (W}cha...] Co cha...| Ddset1 [3 uns... fd ss. (whcha... [BF (W)3 po. ||f Seaich Desktop [OBO PO GS 163
Figure 3-87
Ms] 6 OB 0)
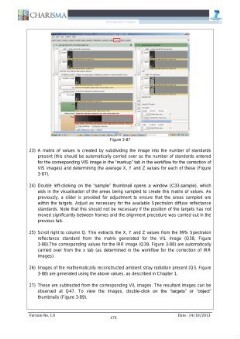
23) A matrix of values is created by subdividing the image into the number of standards
present (this should be automatically carried over as the number of standards entered
for the corresponding VIS image in the “markup” tab in the workflow for the correction of
VIS images) and determining the average X, Y and Z values for each of these (Figure
3-87).
24) Double left-clicking on the “sample” thumbnail opens a window (C33.sample), which
aids in the visualisation of the areas being sampled to create this matrix of values. As
previously, a slider is provided for adjustment to ensure that the areas sampled are
within the targets. Adjust as necessary for the available Spectralon diffuse reflectance
standards. Note that this should not be necessary if the position of the targets has not
moved significantly between frames and the alignment procedure was carried out in the
previous tab.
25) Scroll right to column Q. This extracts the X, Y and Z values from the 99% Spectralon
reflectance standard from the matrix generated for the VIL image (Q38, Figure
3-88).The corresponding values for the IRR image (Q39, Figure 3-88) are automatically
carried over from the x tab (as determined in the workflow for the correction of IRR
images).
26) Images of the mathematically reconstructed ambient stray radiation present (Q3, Figure
3-88) are generated using the above values, as described in Chapter 1.
27) These are subtracted from the corresponding VIL images. The resultant images can be
observed at Q47. To view the images, double-click on the “targets” or “object”
thumbnails (Figure 3-89).
Version No. 1.0 175 Date : 14/10/2013